Water footprint – what is it?

It is this value that tells us how much water we use. Not just when we brush our teeth or do the laundry. We also use water on the other side of the world. How is this possible?
The water footprint tells us how much water we really use. It determines the sum of the water we use directly and indirectly (virtual water). Directly, we use water for drinking, washing, laundry or cleaning – we can easily determine the amount because we can see when we use it. Indirectly, we consume virtual water, which also comes from global, depletable freshwater resources. The production of every thing we use, wear, buy, sell and consume requires water, it is this water, used in the production process, that is virtual water.
The water footprint measures the amount of water used in the production of each good and service we use and can be calculated for an individual person, a community, a city, a country, or humanity as a whole.
The water footprint consists of three components:
- The green water footprint indicates the amount of precipitation water used
- The blue water footprint indicates the quantity of water used which is abstracted from surface water and groundwater resources
- The grey water footprint indicates the amount of water which becomes contaminated during the production process
The water footprint calculated for a specific country takes into account the sum of water used to produce all goods and services consumed by its residents and inhabitants. It consists of two components: the internal water footprint (water sourced from the country’s resources) and the external, export water footprint, i.e. imprinted in other countries and regions (water sourced from resources located outside the country).
Poland leaves a water footprint of 54 cubic kilometres per year, and 25 per cent of this resource is water consumed in other countries and regions.
What is 54 cubic kilometres? Imagine our largest reservoir, Lake Sniardwy. It has an area of about 100 square kilometres, and the volume of water in this lake is “only” 0.66 cubic kilometres. We use more than 80 such lakes every year!

Relationship between internal and external water footprint of selected countries in percentage. Own elaboration, source: https://www.waterfootprintassessmenttool.org/national-explorer/
The Water Footprint Network — The Water Footprint Network, a collaborative platform of individuals, companies and organisations that aims to address the global water crisis by promoting fair and smart water use, provides interactive tools on its website jwaterfootprint.org to calculate the water footprint of countries, specific products, processes, services, as well as the individual water footprint.
So what do the figures say? How many litres of water are used to produce each product?
 Own elaboration, source: https://waterfootprint.org/en/resources/interactive-tools/product-gallery/
 Own elaboration, source:
 And how much would that be in the more figurative unit, ‘tubs’?
Estimating that a 160 – 170 cm long bathtub filled to the brim holds around 200 litres of water, the water footprint of some products per bathtub is as follows:

We can see that it takes an average of 15 415 litres of water to produce 1 kg of beef.
What is responsible for such a high water footprint of the product?

Percentage of elements included in the water footprint of 1 kg of beef. Own elaboration, source: https://waterfootprint.org/media/downloads/Report-48-WaterFootprint-AnimalProducts-Vol1.pdf
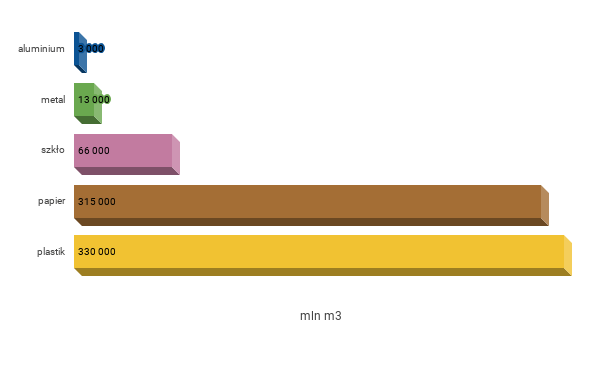
How much water does packaging cost us?
Every year, 400 million tonnes of packaging are produced worldwide. They are used to store food, clothing, electronics and other goods during transport and storage. The production of packaging consumes water resources, which are estimated at 650 to 800 billion m3 of water per year, a ‘load’ that is mainly borne by the countries involved in the production of raw materials and packaging. In addition to the water used at the production stage, there is also the amount of water that becomes contaminated with packaging. Their grey water footprint, which varies according to the type of raw material, shows the scale of the costs hidden by the packaging we use.
average annual grey water footprint of packagings of various raw materials in million m3 Own elaboration, source: https://waterfootprint.org/media/downloads/Topical_analysis_-_World_Water_Day_2017_Final.pdf
By comparison:
- The average annual grey water footprint of aluminium packaging corresponds to the amount of water used for domestic use by London residents for 2.5 years.
- The average annual grey water footprint of metal packaging corresponds to the amount of water used for domestic use by Australian residents for one year.
- The average annual grey water footprint of glass packaging corresponds to the amount of water used for domestic use by residents of France for 2 years.
- The grey water footprint of paper packaging corresponds to the amount of water used for domestic use by people in India for 4 years.
- The grey water footprint of plastic packaging corresponds to the amount of water used for domestic use by Chinese residents for 6 months.
As consumers, we play a role in the drive for better management of water resources
By knowing our own water footprint, we are better able to understand the problem of water scarcity and pollution. Knowing the actual amount of water used throughout the production system and supply chain can help us take action to address these issues. To quote Professor Arjen Hoekstra – creator of the water footprint concept: “Not only governments, but also consumers, companies and community organisations can play a role in the quest for better water stewardship.”
A survey of the environmental awareness and behaviour of Polish residents conducted in 2018 for the Ministry of the Environment showed that Poles do not rank environmental protection among the most important areas in which the state has urgent problems to solve. Within the environment itself, the areas most frequently indicated by Poles were air pollution, the problem of litter and climate change. Low water resources were indicated by 18% of respondents. This makes it all the more apparent that we should be talking about water more.
Let us therefore add a few more points to our aquatic decalogues:
- Let us be aware of our own water footprint.
- Let us consider the water footprint of products when deciding what we eat and buy.
- Don’t waste food.
- Let’s not buy things we don’t need.
- Let’s separate our rubbish.
- Let’s share our knowledge of our water footprint with others.
—
Check your water footprint HERE
Check the water footprint of the products and services you use on a daily basis HERE